This
is speech #1 from "Speaking to Inform" manual, called "Resources For
Informing". The objectives are to analyze your audience regarding your chosen subject, focus your presentation at the audience's level of knowledge, build a supporting case for each major point using information gathered through research, and effectively use at least one visual aid to enhance the audience's understanding. Time allotted
is 5 to 7 minutes.
Data. Big Data. Naam toh suna hoga?
Good Afternoon fellow
Toastmasters. Seriously, there would be no one in the world of technology who
hasn’t heard this name..unless of course one lives in a cave, in which case,
most probably one doesn’t have anything to
do with technology at all.
Jokes apart, Big Data is
something that has baffled many of us at many times. But my friends, nothing
could be simpler to understand. Unlike terms such as cloud computing -which has
nothing to do with clouds or specifically with weather prediction, big data
means exactly what the name suggests – big, huge, large, gigantic, humongous
data.
Imagine the amount of data that you yourself deal with everyday…..on your
office laptop – work files, mails, archives, knowledge sharing docs..then on
your home PC or tablet – pics, videos, music, movies…then the content you
access online….or your data on the “cloud” – on social networking sites,
content sharing websites, or even your email data or browsing history…..things
that the apps on your smartphone remember for you – notes that send you an
alarm across devices, ebooks that are in sync on any device you use, and on and
on. Look at this image on the left…according to visualnews.com…every minute of the day,
this is what users do on an average on the internet.
48 hours of new videos uploaded
on you tube, over 204 million email messages, 2 million searches on google,
3600 photos on instagram, 47 thousand app downloads on the Apple Store…and this
is just one minute. And there are 1440 minutes in a day. 365 days in an year.
Imagine the amount of data. A Zillion
terabytes, isn’t it?
Don’t you think big is a small
word to describe it? Now to organize, capture, and analyze all this data is
such a Herculean task that our traditional data processing techniques - that I
learnt in college ten years ago - fall short. There is a need of multiple high
capacity parallel processors that might be running in a distributed
environment. To support them, we need to have a new set of exceptional software
techniques and technologies; these are also known as Big Data or sometimes Big
Data Analytics. Examples of some software being used today are - Hadoop, MapReduce, Cassandra, Storm. MongoDB and many more.
To study big data, you should first understand its nature and attributes. There are various characteristics
of Big Data..but the 4 Vs stand out – Volume, Variety, Velocity and Veracity.
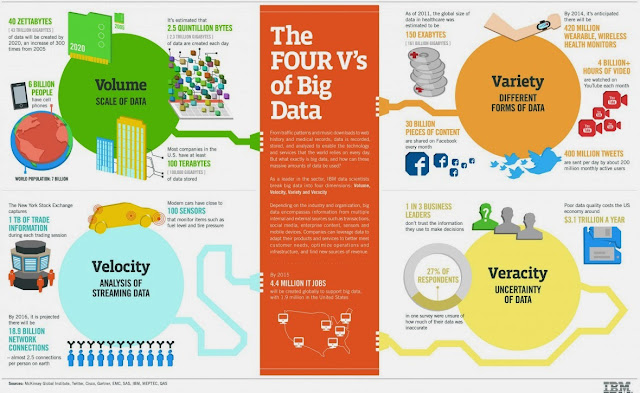
This infographic from IBM best describes the 4 Vs.
Volume: Scale of data; we already
saw a sample in previous slides. Variety: different forms of data – text,
images, audio, video. Velocity: Analysis of Streaming Data – increasing speed
with which the data is getting uploaded and has to be analyzed; and Veracity: Uncertainty
of Data – whether the data is accurate and how to determine the accuracy.
 |
| Image Source: http://www.systems-thinking.org/dikw/dikw.htm |
Now you all might say…ok…big data..means lots of
data…with volume, variety, velocity, veracity. So What?? Well...to understand and decipher all
these zillions of bytes of data, to uncover correlations that you didn’t know existed, and then to
predict user behavior is what Analytics is all about. This can involve data
mining, predictive analytics, forecasting, optimization, artificial
intelligence and what not.
Eventually, after applying all these techniques, an answer would emerge as shown in this graph.
Data, when structured and correlated, becomes
information; information, when interpreted and sifted for patterns, becomes knowledge; knowledge, with a little bit more understanding and correctedness,
transcends to wisdom. With the application of this DIKW pyramid of information
science, the future might just become a better, or wise place to live.
Like any scientific discovery,
invention or innovation, it is up to us how to use this wisdom when we ultimately get there. Not just doing
things right, but doing the right things. Not just the what, how and why of things, but doing what is best for the greater good.
 |
|
Image Source: http://en.wikipedia.org/wiki/File:DIKW.png
|
Sources:
This
speech took 8 minutes to deliver and was appreciated for the subject (the audience being an IT crowd),
research and the visual aid : PPT.


